Call Arrival Distribution – An Analysis
This document considers the nature of call arrival distribution and how this might affect a workload forecast and, consequently, staffing requirements for a contact center.
Normal Call Arrival Distribution
Most call centers will exhibit their own ‘normal’ distribution curve over a 24-hour period. There will be quiet and busy parts of the day and these can be seen to follow a predictable pattern. However, as we shall see, the degree of predictability may vary from center to center and from queue to queue.
Consider a single queue on a typical Wednesday:
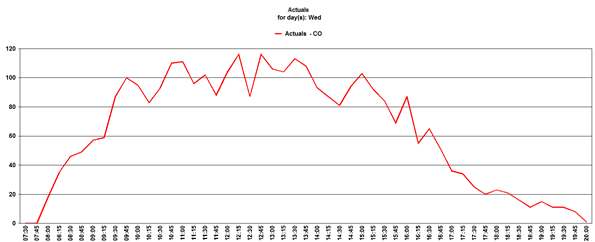
The call arrivals follow a typical distribution pattern – a sharp rise or the first couple of hours, then fairly constant until a steady decline starts mid-afternoon. However, within the general distribution pattern there can be quite a lot of variation from one timestep to the next.
Comparing this Wednesday’s call volumes with the previous week:
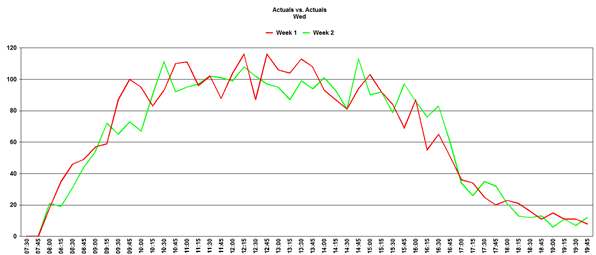
This follows the same general pattern but again shows that individual timesteps may not follow the natural curve – this is known as Variability and is an expected phenomenon is call arrival patterns. Note: it is worth considering at this point that some variations in call distribution may, in some cases, be event driven. If this is a possibility, then further analysis of the distribution is in order and may require the creation of one or more Special Events to record and predict these variations. When generating a forecast, the default behavior is for the program to distribute the daily forecast based on an average of the last 6 weeks of data. This has the effect of smoothing out the distribution curve to some degree. Below is an example:
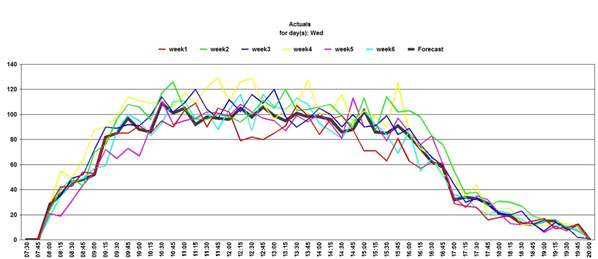
As can be seen, the forecasted distribution has a smoother curve than any individual day’s actual data. However, because of the nature of call arrivals, any comparison between the forecast and the actual data is likely to show a high variability for some timesteps. The default of 6 weeks is chosen as that is sufficient to smooth the more extreme fluctuations. Averaging over a longer period would make the curve even smoother but could result in any changes in distribution taking longer to be reflected in the forecast.
It is the nature of things that when considering lower volume queues the perceived variability appears higher.
Here is an example of a low volume queue showing two consecutive Wednesdays:
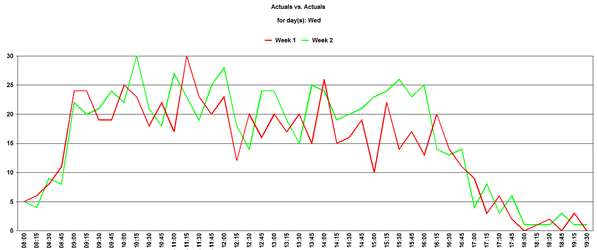
In this example the call volume, while averaging around 20 calls per interval during the day, can change by more than 50 % from one interval to the next in an unpredictable pattern.
Again, the forecast for a future Wednesday will smooth out some of the peaks and troughs but these are still likely to be manifest on the day itself.
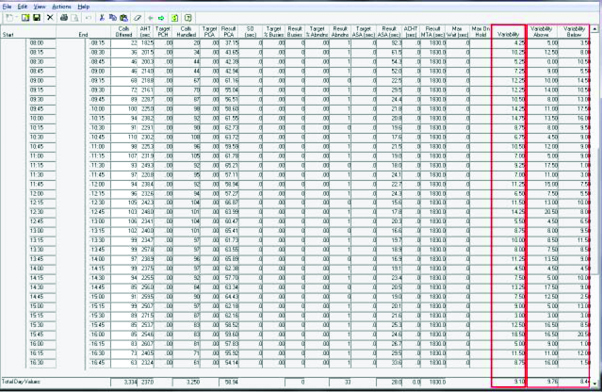
The variability of any particular queue can be viewed within Vantage Point (via the Edit Forecast Data option).
Background mathematics
For those who wish to understand the mathematical approach used by the Vantage Point forecaster, the following text is an explanation of how the Variability is calculated:
The statistical analysis of the data within any timestep interval assumes a random arrival distribution, as there is no known observation of any other type of distribution. The values of Variability Above and Variability Below are relative to the median of the data set used to determine each timestep level values.
The median of the each timestep data set is computed, then the average value of all data elements that are above the median is calculated for the Variability Above. Similarly, the average value of all data elements that are below the median is calculated for the Variability Below. The Variability result is the average of the sum of the absolute values of the differences of the data elements relative to the median.
If the Variability is of the order of the standard deviation of the call data, that is:
square root of (events offered in the interval)
then the median will be as good an estimator as any. The default forecaster behavior, as implemented without directives, removes any outliers based on this criterion and calculates an average over all data elements within one standard deviation of the median.
Compensating for variability
On the face of it this phenomenon should be of concern when it comes to calculating the staffing required. If the call volumes can be so unpredictable, how can staffing be accurate and, therefore, quality of service achieved?
In practice the Merlang® algorithm takes account of this when calculating staffing requirements. Firstly, it takes account of normal variability within the calculation. For a given interval there is a probability that there will be a higher or lower volume than predicted and Merlang® takes account of this when calculating the number of staff needed to meet a particular quality of service. It will always ‘overstaff’ to the degree required to account for this probability: this is part of the reason that predicted Occupancy levels are as they are.
Also, because a spike in one interval is likely to be offset by a dip in another interval, these two will tend to cancel each other out over the day assuming timesteps are of relatively short duration (typically 15 or 30 minutes).
Conclusion
There will always be variability present in the call arrival distribution when comparing one day with another. It is also likely that the lower the call volume, the higher the perceived variability. Providing this is within reasonable limits then the requirements calculation will take this into account. Where the variability appears excessive, further analysis of the data might be required to try and identify a root cause (which is likely to be an external factor) so this can be incorporated in the forecasting methodology, for example through adjustments in the IOT used in the relevant service set.
About Pipkins
Pipkins, Inc., founded in 1983, is a leading supplier of workforce management software and services to the call center industry, providing sophisticated forecasting and scheduling technology for both the front and back office. Its award-winning Vantage Point is the most accurate forecasting and scheduling tool on the market.
