Forecasting for low volume queues
1. Introduction
Queues which record a low volume of calls per day have certain characteristics which may require them to be treated differently for forecasting purposes. Any queues which demonstrate one or more of the following properties could be considered to be low volume queues (LVQs):
- Intermittent historical interval data – there are time steps within the normal service hours where no calls are received.
- Unpredictable call incidence pattern – the arrival pattern of calls over the service hours is irregular or very different from week to week.
- Large week to week variability in volume as a percentage of the average (excluding any seasonal variations) – see examples below
The following screenshot shows a high volume queue week on week variation:

In this example the week on week variation in volume is never more that around 15%.
Compare this with a low volume queue:
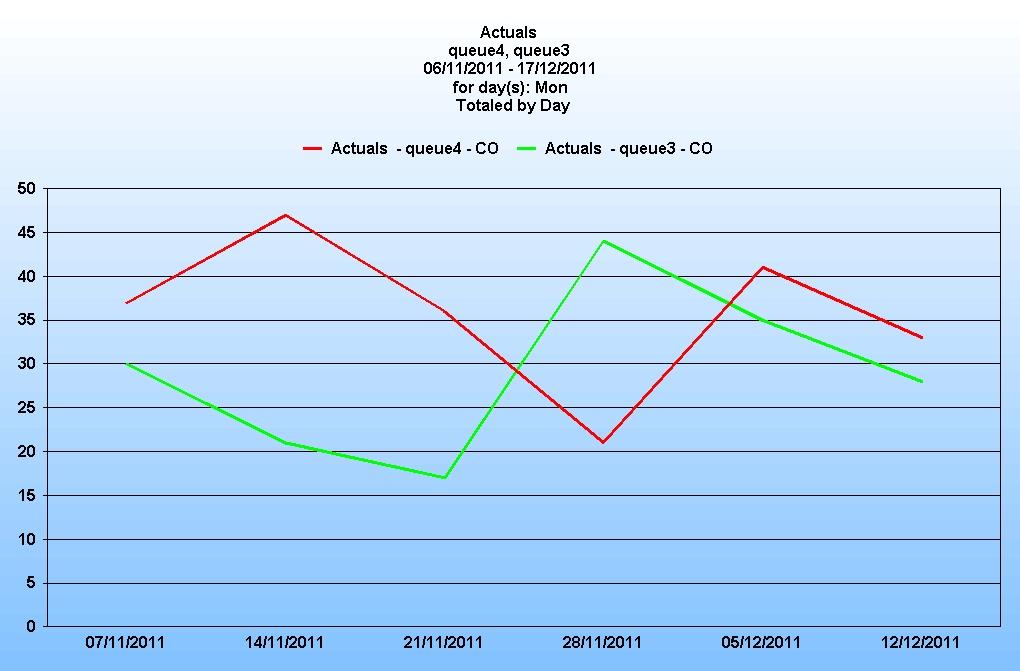
In these two cases the percentage variation from low to high is over 100%.
2. The forecaster’s dilemma
When forecasting for LVQs, the forecaster (and the forecasting engine) face some challenging questions on which to base the forecast. Because of the high week on week variance, should the forecast account for the worst (i.e. highest call volume) scenario at all times, as there is a finite possibility that this may happen in any given week?
Also consider the pattern of calls arriving over the day. The following example shows the actual arrivals for two queues on a Monday:

And here is a comparison of one queue for consecutive Mondays:
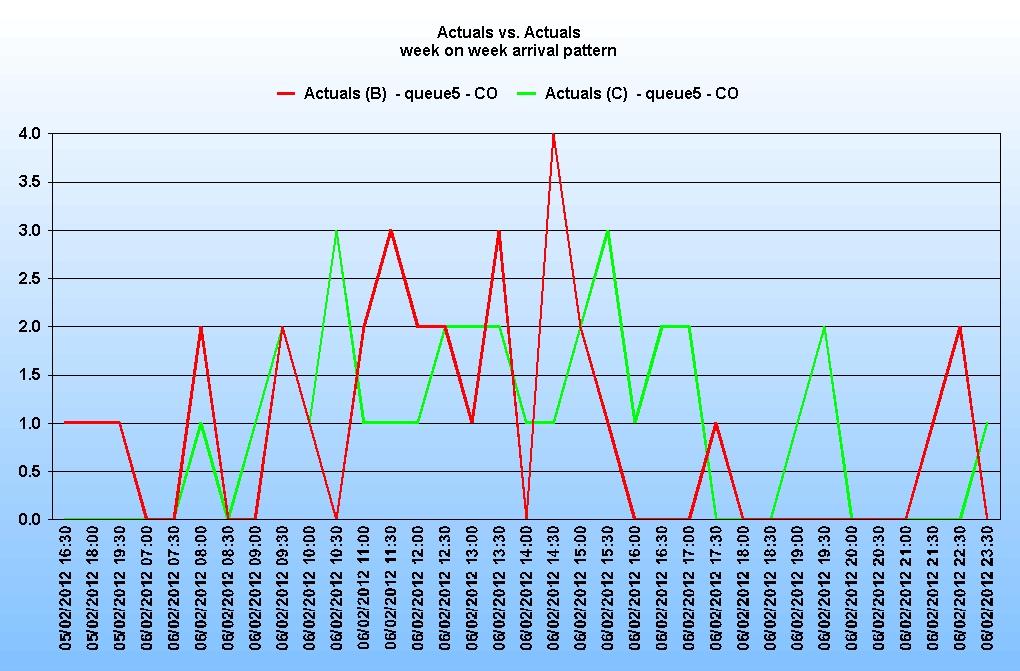
There is no discernable pattern on any day, or in any given week.
Because the call arrivals over the day are sporadic and unpredictable, calls could arrive in any quantity in any timestep. So for a given daily total of calls forecast, how should these be distributed?
If, for example, the forecast volume is 50 calls, and the day has 48 half hourly intervals, should the calls be distributed at 1 per half hour? The chances of the calls arriving in this orderly fashion are extremely low – but then the chances of them arriving in any other specific pattern are equally low. The fact is that there is a finite possibility that a (relatively) large number of calls could arrive at any time. The question therefore is how to forecast this and, ultimately, how to provide an appropriate number of staff.
3. Adopting a strategy
There are a couple of strategies that can be employed when looking to forecast for LVQs:
3.1 Aggregating the queues.
The best option is to group the LVQs together (possibly with a higher volume queue) to form an aggregate queue. Aggregating the queues for forecasting purposes solves some, if not all, of the issues raised above. With larger volumes come fewer extremes in week on week volumes and more predictability in arrival patterns as the aggregate has a ‘smoothing’ effect.
Here is a graph showing the daily distribution of 20 LVQs aggregated:

And here is the week on week daily volumes:
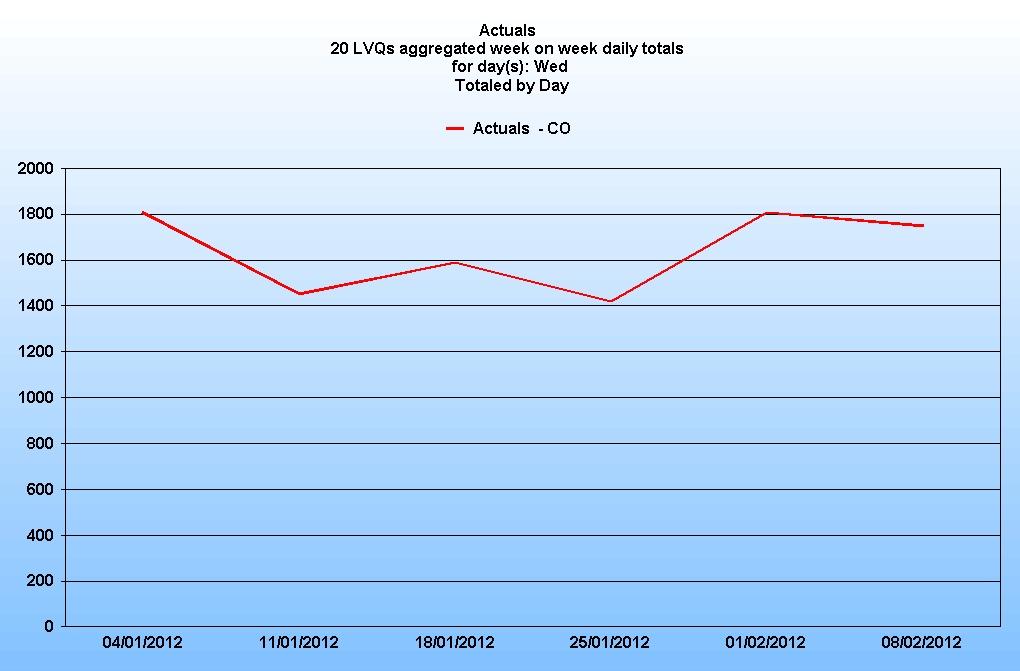
So by aggregating the queues you can arrive at a much more consistent data set and from this a much more reliable, and meaningful, forecast. Generally speaking, the higher the aggregate call volume, the more stable the historical data set and therefore more reliable the forecast.
Although this is probably the best method of forecasting these queues, it may only be practicable if the resulting aggregate queue calls can all be handled by the same agent skill set. It may be necessary to create several aggregate queues made up of different groupings based on call routing requirements. This may also be achieved by aggregating some LVQs with higher volume ones to get the required result – this needs to be worked out to suit each individual company’s configuration.
It is worth pointing out that a situation where a small set of agents are handling a small number of calls from one or two LVQs is not a desirable state of affairs either from a forecasting or an efficient staffing perspective.
One option worth considering is that where some agents take calls exclusively from an isolated queue, particularly a low volume queue, then that queue may well be best handled by aggregating into a larger set. The agents skilled in those calls are then a member of a larger team even though technically the other members do not handle that queue (although in reality they probably do indirectly if that agent is not available). This will smooth the requirements and if a call comes into that specific queue the routing system will know to send the call to the appropriate agent even if they are busy. The call will then queue until the agent comes free.
3.2 The ‘steady state’ theory.
Another option is to determine a mean volume of calls for these queues and make that the ‘standard’ call volume (and subsequent interval distribution). This may be necessary where, as described above, there are only a small number of agents who can handle these low volume calls. The resource planner must decide what the representative call volumes will be and how they should be distributed.
This determination may be based on cost or on quality of service. The former may result in a poor service to the customer if their call happens to coincide with other calls arriving at the same time. Or, conversely, if a high quality of service is required then this will result in the queue being overstaffed for most of the time to provide cover for the unpredictable times of high call arrival.
If these same agents were, for example, able to perform other back office activities to account for the rest of their time then this approach may be more acceptable.
While there will be occasions where one of these approaches is necessary, neither is an optimal solution.
4. Using Vantage Point to forecast low volume queues.
The Vantage Point forecaster is a sophisticated tool. However, it should always be borne in mind that it uses mathematical algorithms and does not possess any supernatural powers. It is therefore sometimes necessary to give it ‘hints’ (which we call directives) to assist it in producing the most appropriate, and accurate, forecast for a given situation. Forecasting for low volume queues is one such situation.
In this exercise we are looking at a group of 5 LVQs and comparing them to one week’s actual data. Given the volatility of these queues the forecast is unlikely to match one single week too closely as we are comparing a single week with a weighted average. However, some general conclusions can be made:
Because of the unpredictable nature of LVQs it is unlikely (but not impossible) that the forecaster will find a pattern in the historical data on which to base the forecast so, assuming no directives are used to override it, the forecast is likely to be based on a weighted moving average. The default for this is to use an average that is exponentially weighted, so giving the most recent week the most weight. Again because of the unpredictable nature of these queues, this may not be appropriate and a smoother average may be preferable.
If the queues are forecasted individually using the default method it is likely that the forecast will be too high.
The graph below shows the forecast for the queues viewed as a group as compared to the previous week’s actual data:
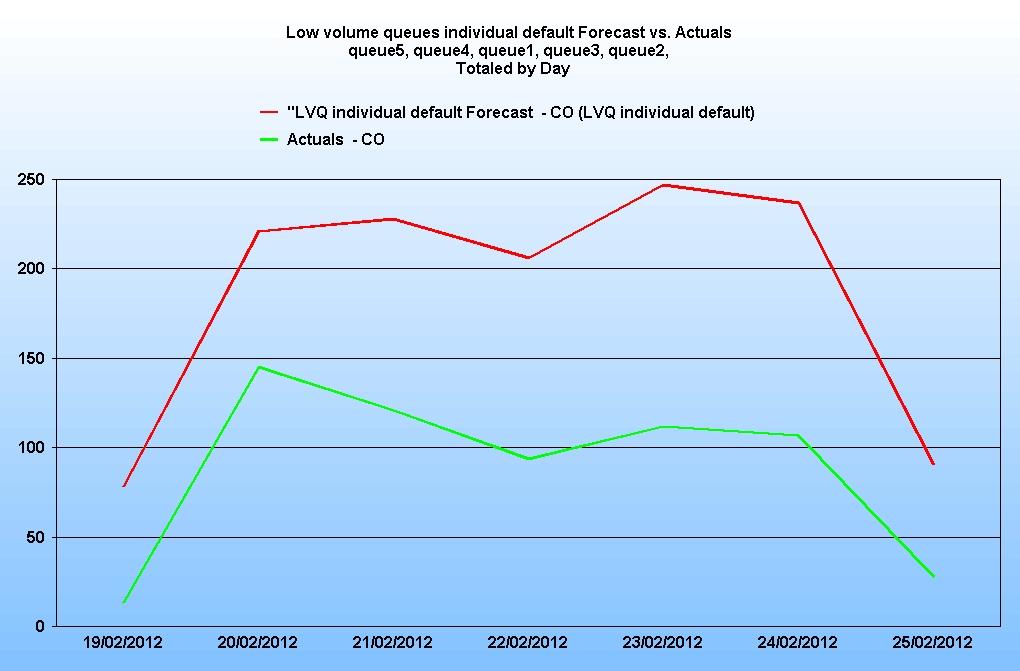
The forecast appears to be too high. The reason for this is that most ACDs do not report on a queue when no calls are received. Consequently the timestep is not created in the database where there are zero calls. The forecaster is designed to examine the historical data and to automatically populate the data with a smoothed value for any missing timesteps. This ensures that, under normal circumstances, the forecast is not thrown off by the odd missing interval of data.
However, as we have seen, LVQs may have many missing timesteps and if all these timesteps are being populated by the forecaster with smoothed data it has the effect of disproportionately increasing the call volumes and hence the forecast. So for LVQs the default is likely to be inappropriate.
Note: it is worth making the point at this stage that the planner has responsibility for determining which queues may be defined as ‘low volume’.
There is a directive to tell the forecaster not to insert these missing timesteps:
(MIL) disable filling in missing data;
Note: forecasting directives can be either MIL (Master Instance Level) or QL (Queue Level), which indicates which part of the layout is used. Typically MIL directives apply to the whole ‘job’ (i.e. the forecast’) whereas QL directives are set at the individual queue (or queue group) level.
When this directive is incorporated, this is the result:
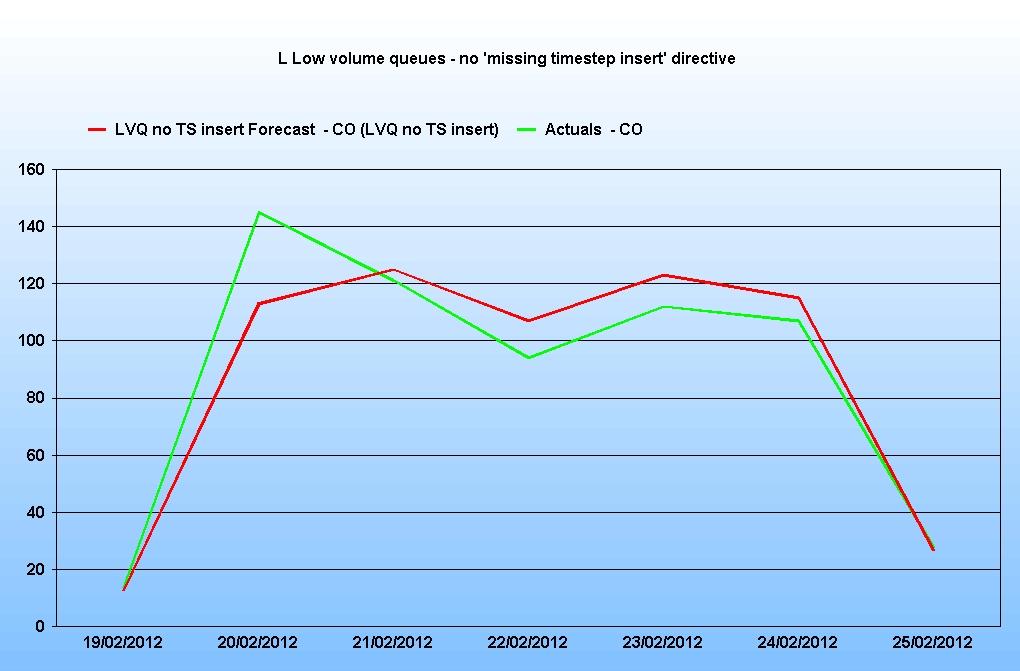
The forecast is now a lot closer to previous actual data.
There are other directives available which can assist in producing a forecast:
One option is to initially produce a daily forecast for the queues using the directive:
(MIL) forecast by daily interval within for date end date;
In our example, this forecast was produced:
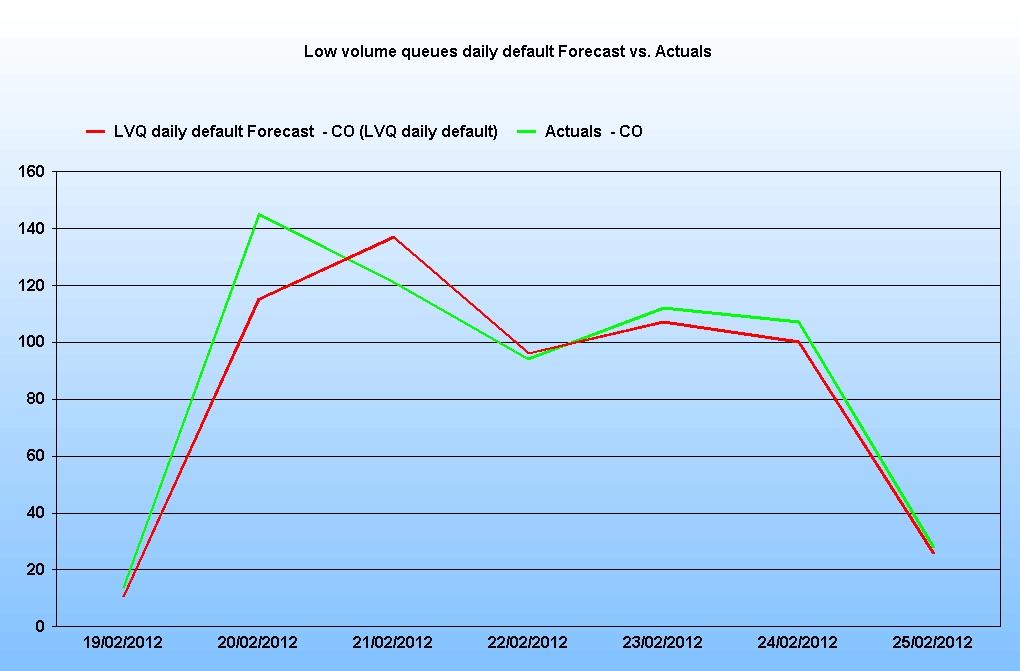
Again, the results appear acceptable based on previous weeks. However, a second step is required to populate the results to the timestep interval. The daily forecast should be written to a different scenario (for example to the ‘Daily forecast’ scenario) and then a second forecast run using this directive:
(QL) normalize forecast data for ‘name’ and ‘name’ queue from ‘name’ scenario;
This will distribute the results to the timestep level in the required scenario. (note that this is a queue level directive)
4.1 Aggregate Forecasting
As mentioned earlier, the recommended method of forecasting LVQs is to group them together to create an aggregate forecast. Ideally they should be grouped with a higher volume queue to overcome the issue raised above where there may be missing timesteps. If the grouping consists of too few queues, or the actual data is very intermittent then the missing timestep issue may persist.
For example, the graph below is of an aggregate forecast for 5 LVQs:
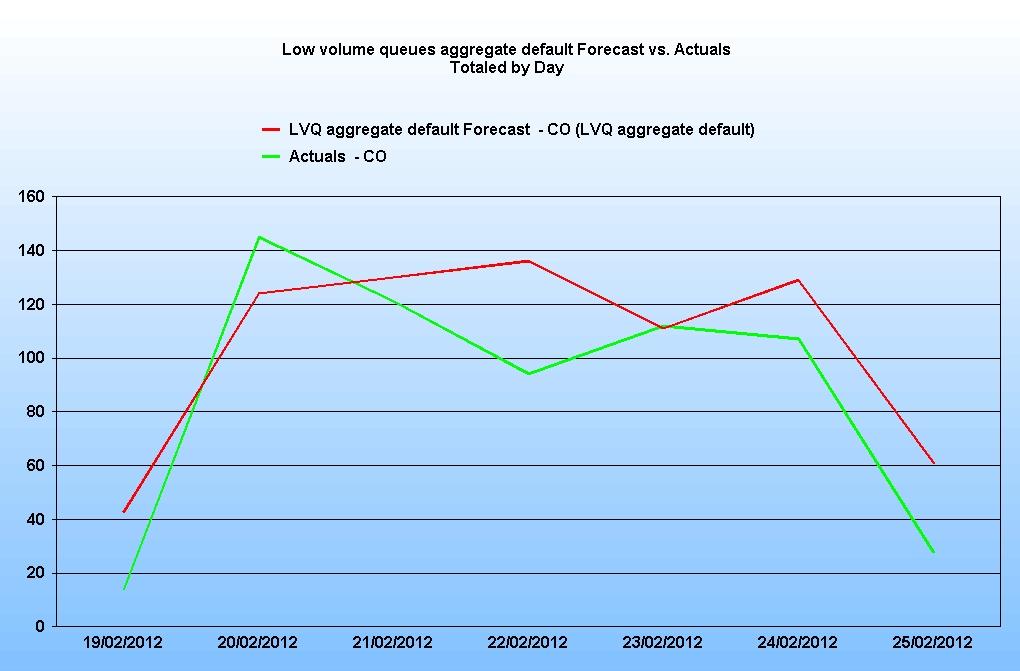
Some of the days, particularly the Saturday and Sunday (shown here at the beginning and the end of the week) look high. This is likely to be because the forecaster is still inserting any missing timesteps.
It is recommended that the directive mentioned before is used here also to stop missing timesteps being inserted. The forecast would then look like this:
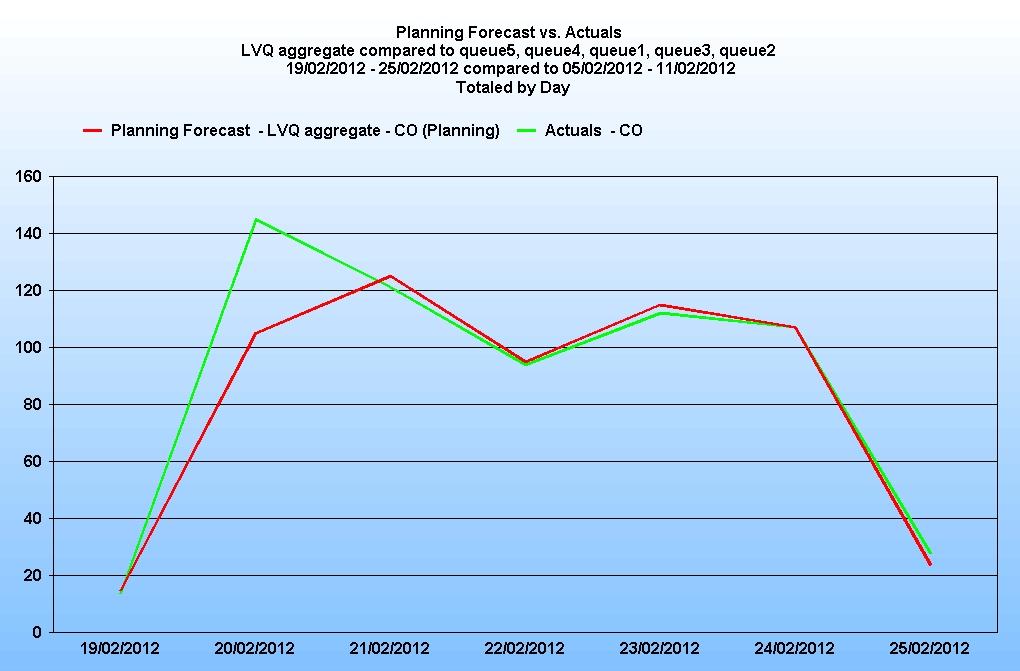
4.2 Pattern recognition and Trending
The way in which the forecaster is asked to interpret the historical data needs to be considered when forecasting for LVQs. Below is the history for a LVQ over the last year:

Two things should be recognised from this:
- There does not appear to be any underlying pattern.
- As previously mentioned, there can be large percentage fluctuations in volume from one week to the next.
Because of these issues, the recommendation is to set the forecaster to not recognise any historic patterns so it produces a weighted average only and to adjust the weighting so it is not focussing too much on the most recent weeks but averages over a longer period. This will help to smooth out the week on week fluctuations.
So the ‘Auto detect growth trend’ should be de-selected and the slider set to zero, and the following directive should be used to alter the average weighting:
(MIL) set the exponential weight to be used for forecasting to x.x;
The value of x.x should be less than or equal to 1.0.
The closer it is to 1.0 then the more evenly it will regard each day of historical data when calculating the average. A value of 0.9 would be a good place to start.
N.B If, on examination of the historical data, there appears to be seasonality in the LVQs then an alternative method of forecasting might be more appropriate and directives to recognise seasonality should be used. These are discussed in another document.
5. The requirements calculation
As we have seen previously, the arrival pattern of calls in LVQs is sporadic and unpredictable with any accuracy. This unpredictability can be moderated by aggregating the queues. The higher the volume of calls presented to a team, the more predictable the volume and distribution and also the more effective the team.
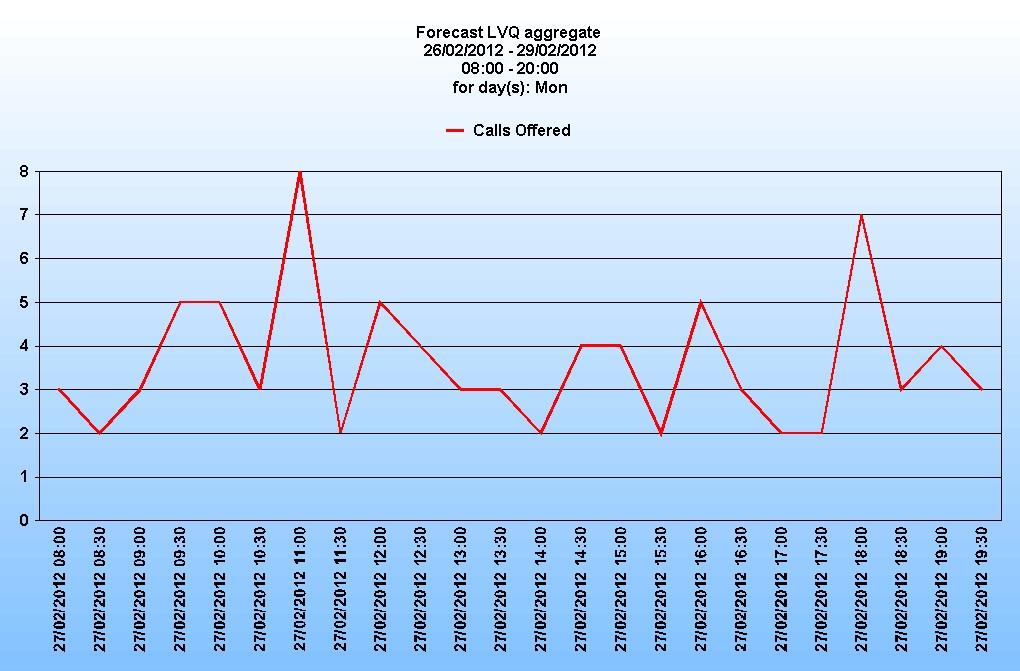
To illustrate this, consider the 5 LVQs discussed earlier. Even if these are aggregated into one queue, the daily total of calls is still below 150.
If we calculate the requirement for this aggregate queue, the figures look like this (based on an average handling time of 335 seconds and a PCA target of 80% in 30 seconds).
Firstly the call arrivals:
Secondly the resultant requirements:
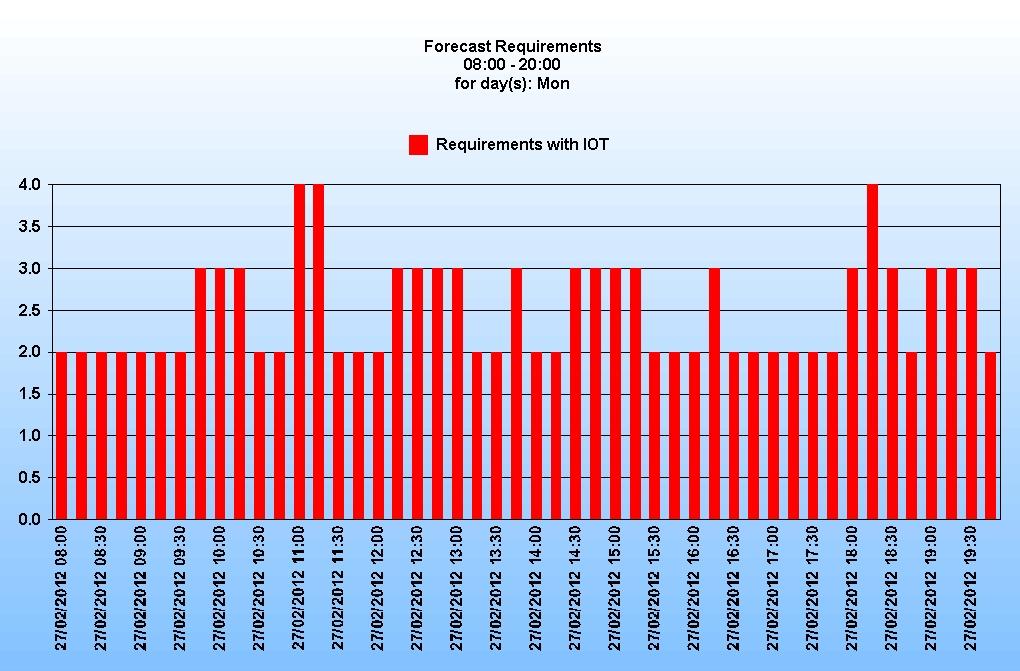
It is worth noting that even when the forecast is for 2 or 3 calls in an interval, the requirement is still for 2 agents. This is because the calculation has to account for the possibility of those 2 calls arriving close together, meaning one agent would still be handling the first call when the second arrived.
It is also worth pointing out that the percentage occupancy of the agents in this scenario is less that 30 % over the day. Compare that to the example above where the LVQs were aggregated with a higher volume queue and the occupancy is nearer 75%.
6. Conclusions
Forecasting for this type of queue requires some thought and planning.
This will involve:
- an examination of the historical data, both at the day and interval level,
- consideration of how these calls will (or could) be presented to the agents,
- re-configuration of the queues and serving teams as necessary.
In general, the following recommendations can be made:
6.1 Aggregate wherever possible. This will improve the accuracy of the forecast as well as the effectiveness of the teams servicing the queues and, ultimately, the service to the customer.
6.2 Take account of missing data and use the appropriate directive.
6.3 If aggregation is not possible, or where the aggregate queue is still of low volume, forecasting by daily interval initially may be more appropriate.
6.4 It may also be desirable to disable the pattern recognition and adjust the weighting for the average calculation.
While forecasting for Low Volume Queues will never be an exact science it is hoped that the above insights and recommendations will assist in producing the best forecasts possible.
